Obesity in United States
An Epidemic or Pandemic?
For:
Professor Shin
By:
Shayda Haghgoo
Introduction
With the present discussion of the Health Care Bill playing an important role in politics, it seems appropriate to incorporate an analysis regarding one of the most controversial health concerns in America today, obesity. All over the media, “The Obesity Crisis” has made its way as a top story headline in the United States. Allegedly it is one of several problems many Americans face these days, along with the detriments of the recession. As a fellow American Citizen, the media bombards me with documentaries like Super Size Me and Food Inc. regarding the obesity issue, while I end my nights watching Jon Stewart joke about the gluttony of Americans on The Daily Show with Jon Stewart. However, it has come to my attention that the media has described obesity to be both an epidemic and a pandemic, without clear elaboration to which geographic widespread occurrence they really mean. If many Americans all over the US are going through such a crisis, how can an epidemic span across such a wide distance just short of 3000 miles? This analysis is going to geographically evaluate the semantics of pandemic and endemic in context of “The Obesity Crisis.”
Oxford American Dictionary defines epidemic as, “a sudden, widespread occurrence of a particular und going esirable phenomenon,” while delineating pandemic to be, “of a disease prevalent over a whole country or the world."
Obesity, by the Centers for the Disease Control and Prevention (CDC) is defined by a person’s BMI. If an adult possesses a BMI of 25 to 29.9 he is characterized as overweight. If this individual holds a BMI of 30, he is considered obese. Kids and Adolescents' BMI involve individual calculations and results do not have such standards numbers set like adults. Although there are numerous factors, which influence obesity, its primary contributors, follow the Caloric Balance Equation. Presented by the CDC, Associations with the Caloric Balance Equation involve:
· Overweight and obesity result from an energy imbalance. This involves eating too many calories and not getting enough physical activity.
· Body weight is the result of genes, metabolism, behavior, environment, culture, and socioeconomic status.
· Behavior and environment play a large role causing people to be overweight and obese. These are greatest areas for prevention and treatment.
The sample data sets used for this analysis incorporate:
US County Level Estimates of Diagnosed Diabetes in 2007
US County Level Estimates of Obesity in 2007
State Obesity Percentages of Children 2-4 years
School Health Profiles of 2008:
Percentage of Schools that Teach All 12 Physical Activity Topics Including:
· Physical, psychological, or social benefits of physical activity
· Health-related fitness
· Phases of a workout
· How much physical activity is enough
· Developing an individualized physical activity plan
· Monitoring progress toward reaching goals in an individualized physical activity plan
· Overcoming barriers to physical activity
· Decreasing sedentary activities such as television viewings
· Opportunities for physical activity in the community
· Preventing injury during physical activity
· Weather-related safety
· Dangers of using performance-enhancing drugs such as steroids
With a focus on statistics of schools that each decreasing sedentary activities such as television viewings.
I intend to create a geographic analysis on three different samples sets of obesity data in order to confirm my hypothesis that this crisis, is a pandemic spanning across the country influencing Americans from all regions of the United States.
Methods
Data Acquisition
The primary collection of data was entirely contributed by CDC. The acquisition of data was made possible through various publications, links to data trends and provided Excel sheets either hidden deep within their website or right on the front page.
Hot Spot Analysis
According to the Esri ArcMap Website, when conducting the Hot Spot Analysis, a Getis-Ord Gi statistic is computed for each attribute. In figure 1 a Hot Spot Analysis was done of Diabetes Percentages and Obesity Percentages of Adults by County. What is outputted is the Z score. The Z score lets one know whether attributes of high or low values cluster spatially. In order for values to be statistically significant and thus a Hot Spot, a feature will have a high value and surrounded by other features that also have high values. The sum of all features are used as a base for comparison of local sums and its neighbors. A statistically significant Z score results f the local some differs greatly than the expected sum, and the difference is much greater to apply random chance as reasoning.
Z-score and P-score
Z-score is calculated by means of standard deviation. High and low negative Z-scores that also possess very small p-values are located both the upper and lower quartiles. P-values usually indicate a standard error in regards to the outputted Z-score. So if the p-values are very small and there exists very high and very low Z-scores then the random patterned reasoning contributed by the null hypothesis can be rejected.
Central Mean
This tool locates the more centrally located attribute by applying the calculated sum of each feature centroid. The associated the shortest centroid that possesses the least accumulative distance to all other features is selected and created into a new layer with its own feature class.
Choropleth Map
The application of shading, coloring, symbols of various gradients to depict average value of some attribute in those areas. This type of map was applied to data from obesity prevalence among children 2-4 years old by state (figure 2) and the aspects of physical activity taught in school (figure 3)
Results
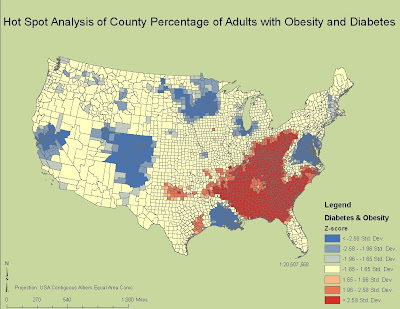
Figure 1. Hotspot Analysis of County Percentage of Adults with Obesity and Diabetes
 Figure 2. Average of Obesity Prevalence Among Children 2-4 Years by State
Figure 3. Percentage of Secondary Schools that Teach Physical Activity Topics by State
The results of the Hot Spot Analysis showed that a high positive correlation between diabetes statistics and obesity statistics in the South, and very low correlation in areas like upper-middle California region and the Midwest. The Z-scores for these ‘hot spots’ are found in both the upper and lower quartile regions of the obesity and diabetes data sets. The contributing p-scores range from 0-0.05 in the 95% stating that these clusters hold statistical significance. This means that unlike my hypothesis, there are regions where diabetes and obesity are most prominent such as the South.
The Central Mean Statistical Analysis was done on obesity percentages among kids 2-4 years old. The resulting output indicates the central mean is more or less located in the Illinois region of the country with the point slowly moving toward the west.
Choropleth Map Techniques applied among children 2-4 years old by state show increasing amounts of obesity percentages in each state by graduating shades of one particular hue. Hues included are red, blue and green. Dark regions like California and Texas possess more of the higher percentages out of the data set. The south also shows fairly high percentages of obesity among children.
Choropleth Map Techniques applied in mapping School Health Profiles used symbols particularly circles of a certain color also graduating in hue. The brightness of a hue and the bigger size of the hue indicate a high percentage of schools that teach all 12 physical activity topics and the particular focus on schools that stress teaching decreasing sedentary activities.
Discussion
The Hot Spot Analysis serves as evidence against my hypothesis. There are clear areas where obesity and diabetes percentages are much higher than in others. Furthermore, there are also areas that contain average percentages lower than normal. This analysis provides another area for further questioning. Why is the South so high in percentage? Why are other areas much lower than normal?
The Central Feature shows that the geographical mean of obesity among children is in the Illinois area but the mean is shifting toward the left. One possible explanation could be that although the average of obese kids is located in the Illinois region it will spread much like a disease throughout the country. This analysis is not very accurate, however, since the data used was by state whereas the Hot Spot Analysis used data by County.
The accuracy of data can also be explained for the choropleth map that accompanies the central feature in figure 2. Additionally, it is wise to note California and Texas will have darker shades because they are bigger states with more populations...but because this is based of percentages, the proportion of the states population is represented. Nonetheless, the amount of data used is not enough to provide evidence that this prevalence occurs throughout the state. But by the distribution of the colors there is no specific region like in the Hot Spot that has higher than normal percentages or lower than normal percentages.
The physical activity topics taught in school show that although the Obesity Crisis has environmental influences like watching too much T.V. The education at school throughout the country is not effective since obesity rates among kids are increasing and the highest values of schools that focus on all 12 subjects are in the same region as the above average Hot Spot values in the South.
It is clear now that although among adults, the obesity crisis can be characterized as an epidemic, yet among the health education and percentage of kids who are obese it is becoming a pandemic occurrence, that if gone unsolved will provide detrimental consequences in the US for years to come.
References
Brener ND, McManus T, Foti K, Shanklin SL, Hawkins J, Kann L, Speicher N. School Health Profiles 2008: Characteristics of Health Programs Among Secondary Schools. Atlanta: Centers for Disease Control and Prevention; 2009.
"Diabetes Datas & Trends." Centers for Disease Control and Prevention. Centers for Disease Control and Prevention. Web. 10 Mar. 2010.
“ArcGIS Desktop Help 9.3”

No comments:
Post a Comment